Monday, April 27, 2015

Final Project Critique

I feel I've made a great deal of progress on my final project. The goal was to create a photo animation of the National Mall. I picked what I thought were the best ten shots. I added transition shots and individual snapshots of the monuments. I feel I'm about 90% to 95% done.


Full size link: http://mason.gmu.edu/~jvigil4/final_project/final_project_01
 
These are some of the questions I'd like to ask:
- Is it easy to navigate?
- If not, how can I improve the navigation?
- More or less text? info?
- Does animation go by at right speed? too fast? too slow?
- Overall suggestions?

Weekly Map 10: Cool and Interactive Leaflet Map Service, USGS TopoView

The USGS, like the rest of the mapping community reacts to changes in technology and public interest when it comes to map services. This new service offers access to the flagship product of the USGS; the topo map. You get access to historic and newer maps available for free at the USGS. BTW this map uses Leaflet technology. Check it out and as it's being tested please feel free to offer comments.


Sunday, April 26, 2015

Lab 10: Heatmap of Shallow Coal Deposits in Alabama

This heatmap shows & ranks 40 drill-hole locations by the thickness of shallow coal deposits present in Alabama. Red indicates thicker deposits and green indicates thinner deposits. Interesting script, I'm not sure it's the best way to present this type of data but I see other uses for it.


Lab 9: Pop Density in Top 20 US Cities by Pop 1980, 1990, 2000 & 2010

This Leaflet map shows the population density (population per square mile) in the top 20 US cities by population. Leaflet, JavaScript and open source mapping in general seem to be where things are heading for now. I'm still finding my way here but it's beginning to make more sense.


Wednesday, April 22, 2015

Weekly Map 8: Heatmap

I spent a lot of time looking for a good example of a heatmap. Surprisingly there aren't that many that I would consider good. This is Google's Sightsmap. I'm not crazy about it but there aren't that many choices.

Monday, April 13, 2015

Weekly Map 7: Zooming and Panning

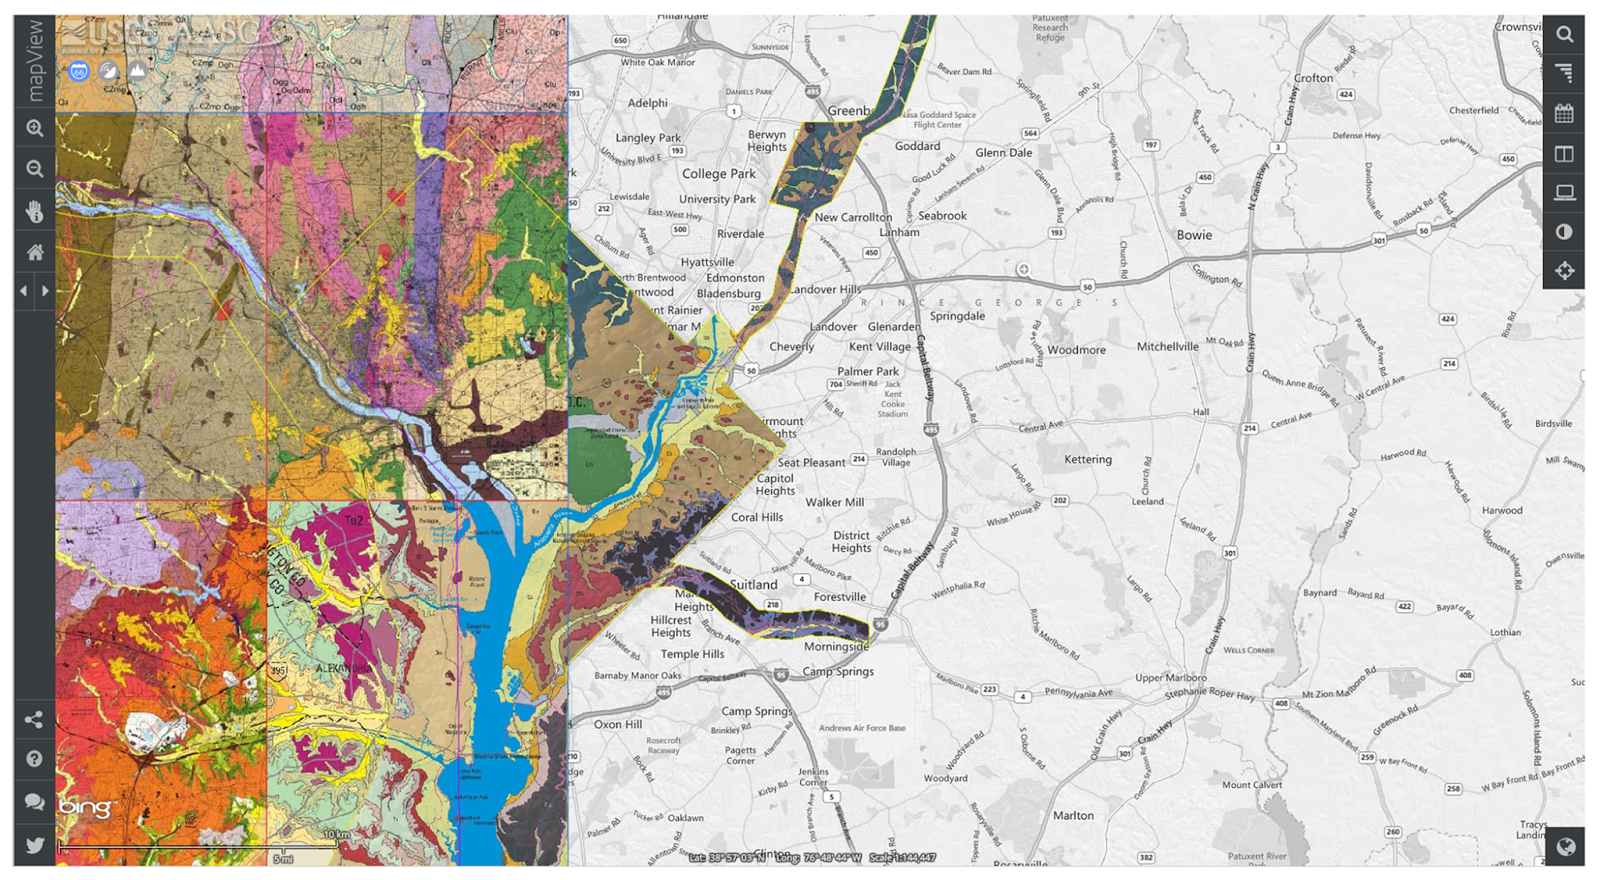
I'm very familiar with this example of good zooming and panning. I like that you can use a traditional zooming tool with a rectangular selection. I also like that you can pan and get info on a particualr map with the same tool. Very cool.

This USGS service gives you access to thousands of Geologic maps in the US.
It's called the National Geologic Map Database (NGMDB)

Saturday, April 11, 2015

Lab 8: Top 20 US Cities by Population in 2013

Here's my first attempt at Leaflet. This map shows the top 20 US cities by population in 2013. Other years will be added as it will be used as a base for Lab 9. Thank you Wikipedia!